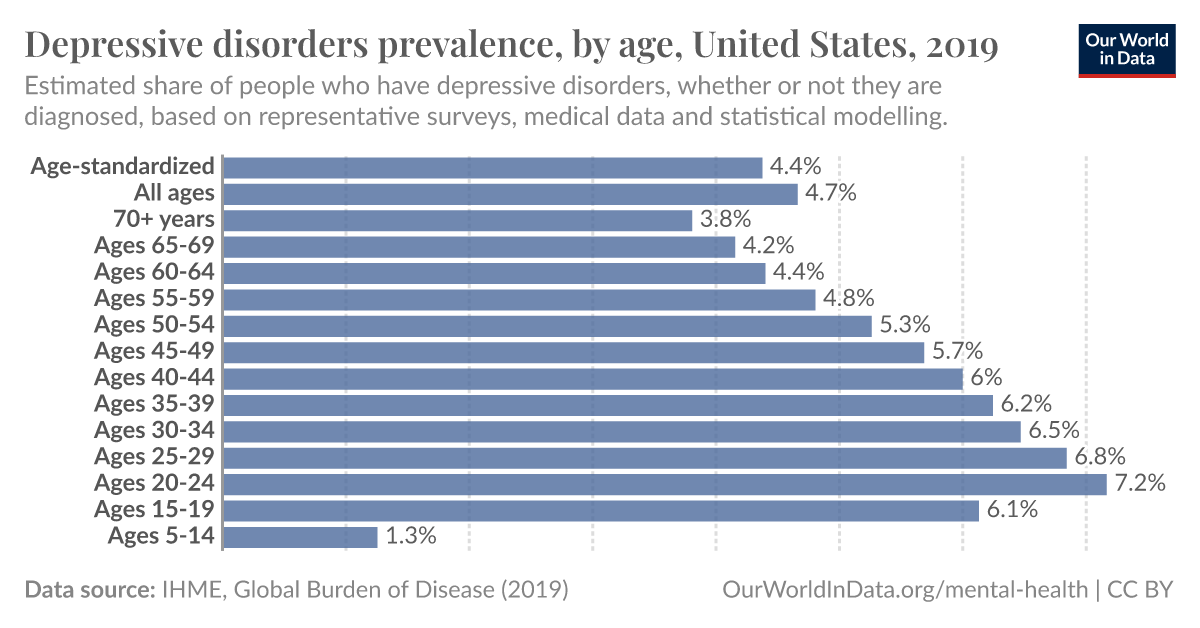
Different countries have different distributions, click “change”. Canada, Australia, New Zealand have similar to the US. France, Germany, UK peak 40-44.
Almost 20 years of schooling, crushing amounts of debt, no respect from elders, and shit income. Sounds about right.
“Got no girlfriend, got no pride”
“Always broke and dead inside”
Forcing adulthood on a precooked brain does that. Couple that with a bleak future, low income, constant influence from every direction… Yeah it makes sense.
There’s probably a very sobering reason for that.
I know, right? Anybody in here who is a statistic will tell you why that number goes down over time.
Could there be a sample bias? I’m willing to bet that young people are more accepting of receiving therapy, and thus more likely to get diagnosed?
Edit: the info says “whether or not they’ve been diagnosed”. Looks like they took it into account. Damn scientists being smarter than me!
That’s really interesting, thanks for the link.
Looking at the UK, there’s an interesting pattern between 2010 and 2019 - the 40-44 group is one of the lowest and is that the bottom of a dip. But by 2019, that same age group is the one with the highest rate, and is at the top of a hill.


I wonder why? What caused that age group and those around it to reverse their order?
You can also see that shift here:

It’s different people in that group 9 years later? 40-44 in 2019 was 30-34 in 2010. In 2010 the 30-34 group was the second highest. Maybe they carry that spike with them over time.
Yeah, maybe.Although, that carry forward effect doesn’t seem to apply elsewhere, or else we’d see the same “hill-valley-hill” pattern shifted up a couple of age groups.
The numbers are probably too small for it to have any real significance, but it’s interesting anyway :-)
Bet it could be directly correlated with income.
You 18: every adult I know is a failure. All they want out of life is a career, a home, a partner, and kids. Don’t they know you just get this stuff by default?
You 24: well fuck me
You 30: the amount of stuff in my life that is currently on fire is pretty low. So today is a good day.
Edit: a word
Well I sure have peaked but my depression hasn’t.
Japan, too.
I gotta say, that’s a great interactive graph. Not only does it allow you to change regions, you can easily change from a single year to multi-year timespan graph to see how it changes over time.
I just wish the timespan graph would display the values still ordered by age. Because I was wondering if would shift with the/a generation getting older or not.
It peaked, but stayed there, going on 15+ years…
Me in Germany:

uuuh… fuck
What do you mean? You’re beating the US in all but a few age brackets.
Because on everyone else’s chart it gets better with age, in Germany it looks like you’re just fucked for life.
Only because it scales relative to the maximum value, it looks worse at a glance when it’s actually notably better.
The maximum value is the population, as a percent of society it doesn’t get better.
I’d feel the same if I was a Kraut.
If I were* a kraut
When using be in an if clause for an unreal conditional sentence, always conjugate it as were, no matter what the subject is. Even if the subject is first-person singular (I) or third-person singular (he, she, or it), still use were with an if clause in unreal conditional sentences.
Yeah, I wrote that before I hit the hay, thanks for the correction.😊👍


